We have seen that how we can post an issue in Bugzilla. Now we will move in next step by learning that how we can create a report here for particular application.
From bug report , you can identify each and every information within short time period. What is the status of the project?, How many work have been done?,How many work is pending? This all question will be answered by generating one report only.
Report will help you to fond out situation of the project or progress of the assigners. It will be displayed largest data with good efficiency.
As this is a graphical report , It will be easy to understand for all of us. This will displays the status of the bug from database. We can decide criteria and Bugzilla will search accordingly and display result through graphical reports.
We can generate many types of report from Bugzilla. Assignment, work done, bug with status, according to project, according to project manager this is all different types of reports.
Graphical reports will be generated in Bugzilla with 3 format.
- Line graph
- Bar chart
- Pie chart
Here is the steps for creating reports.
- Log in with application and enter valid credentials.
- Now click on Report as per screen shot.
- After click on report we will navigate to the other screen where we can find many option from which we need to click on 'Graphical Report'.
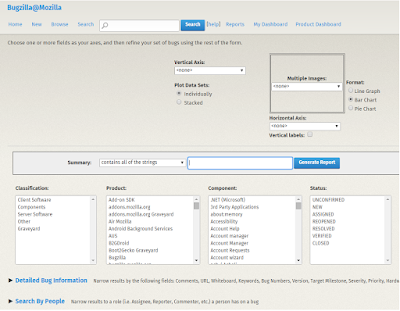
- Now we will navigate to the screen where we need to select criteria. Verify in below image about your searching field And select it.
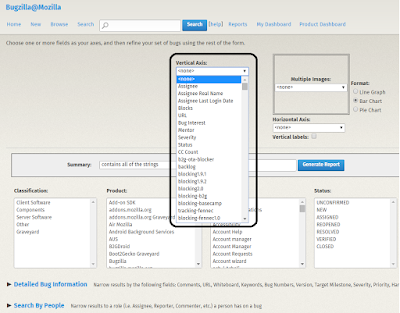
- Here your first field is 'Vertical Axis'. From where you can select the value from drop down for whom you want to create the graph. As we can see in image , Bugzilla will provide us many option for creating graphical reports.
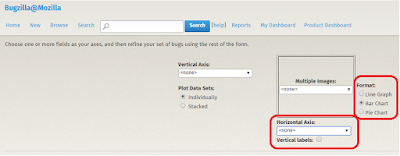
- Then select your 'Horizontal axis'. For this field also we have multiple option. Bugzilla will display report with horizontal and vertical axis. Thus, user can compare all the data properly.
- You can select your format for creating graphical report. Bugzilla is giving you 3 option. Line,bar and Pie chart.
- After wards you need to select other option for report. Like Classification , product component, status, Resolution. This all are the option for which you can create a report.
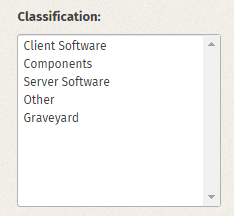
- First we can see the Classifications options , this will same as image.
- Select one option from the drop down and click on 'Generate Report' and verify the result. It will display you report for your selected criteria.
- Now we can move for Product section. Verify the below image for product selection.
- Select a product and click on Generate report.
- As we have seen here, we have selected a product for creating a report. Thus, we can get all the information about this product and we can generalize the status of the product in less time.
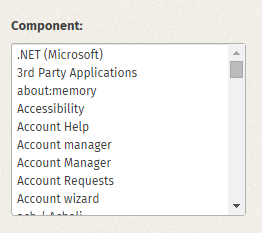
- Now we will move on next tab which is Component.
- Select a component and click on Generate Report. This will display a report for selected component for selected vertical and horizontal axis.
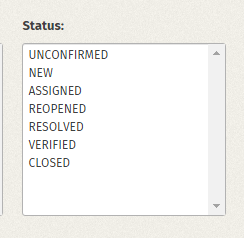
- Now select the status as New, Assigned,Reopen etc.
- Now click on 'Generate Report' and verify the result.
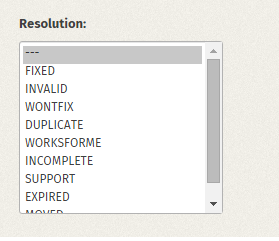
- Same way you can select resolution from drop down menu and click on generate report the report will be generated.
- You can create report by selecting all the valid combination from Classification , product component, status, Resolution.
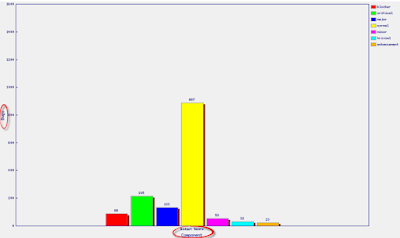
- As we can see in the image , I have selected option from all the tab and then Click on Generate Report.
- Verify below image which shows bar graph and line graph.
This the step by which you can create
reports in Bugzilla.





No comments:
Post a Comment